Aggregate Time Series Data to a Single Multi-Series Grafana Graph
by Paul SymonsContents
Summary
The goal of this blog post is to show you how you can build dynamic multi-series graphs in a Grafana panel using a single SQL query.
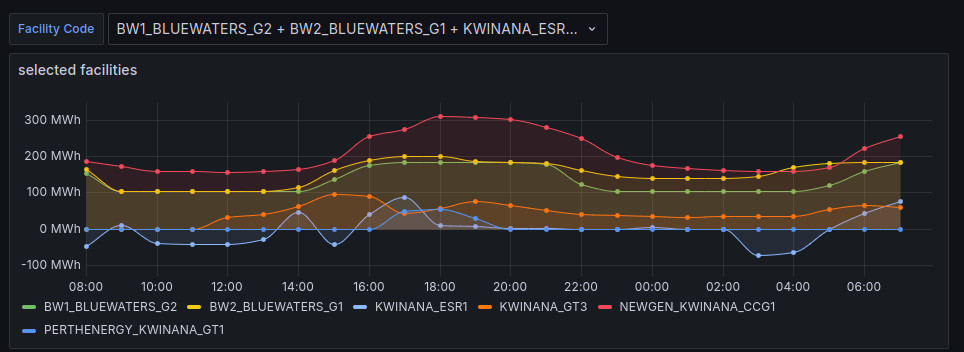
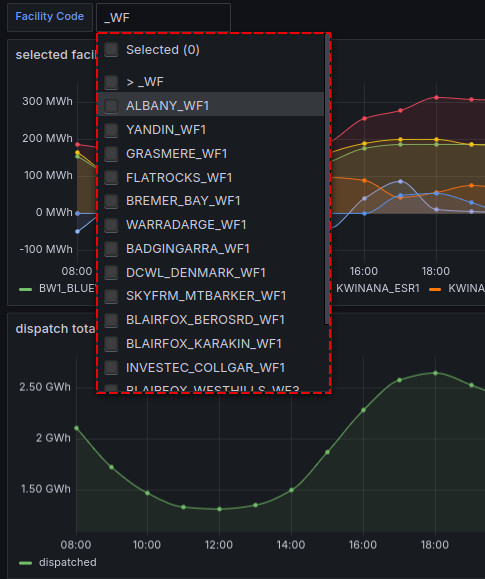
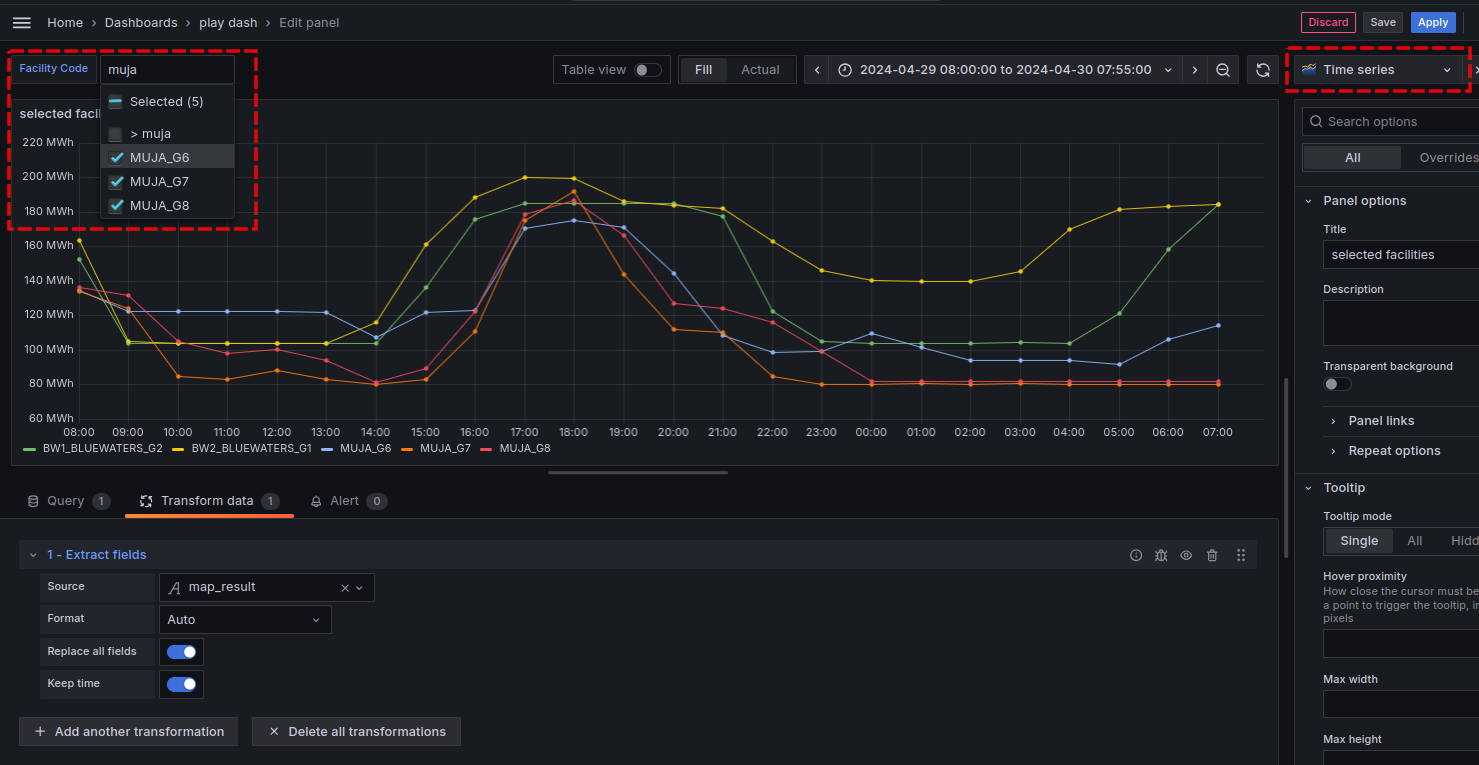
Dynamic means that the series displayed on the graph can be determined by user inputs, for example using Grafana Variables, hopefully as shown in the image below:
When is this useful?
It is useful when the multiple series you want to display, are represented by different values of an attribute column, instead of being separate columns in their own right.
Not useful
In the following example, you don’t need this solution, because the different series you need are separate columns:
| time | series1 | series2 | series3 |
|---|---|---|---|
| 00:00:00 | 2.4 | 9.2 | 5.11 |
| 00:00:01 | 2.6 | 8.75 | 4.95 |
| 00:00:02 | 2.5 | 8.1 | 2.204 |
SELECT
    time,
    series1,
    series2,
    series3
FROM <table>
Job done.
Is useful
In the following example, the solution we describe is helpful because it will allow you to pivot the dimensional values into their own columns, similar to what is shown above:
| time | attribute | value |
|---|---|---|
| 00:00:00 | series1 | 2.4 |
| 00:00:00 | series2 | 9.2 |
| 00:00:00 | series3 | 5.11 |
| 00:00:01 | series1 | 2.6 |
| 00:00:01 | series2 | 8.75 |
| 00:00:01 | series3 | 4.95 |
| 00:00:02 | series1 | 2.5 |
| 00:00:02 | series2 | 8.1 |
| 00:00:02 | series3 | 2.204 |
Keep reading to find out how!
A Data Example
Querying Time Series data sets in Grafana often goes like this: to set up a new graph panel, you
- Choose your data source connector
- Add a query to retrieve the data you want from your data source
- Choose the visualisation type that suits your dataset
Let’s imagine I have a dataset vw_facility_scada as follows
| interval_ts | facility_code | dispatch_value |
|---|---|---|
| 2024-04-29T08:00:00+08:00 | ALINTA_PNJ_U1 | 0 |
| 2024-04-29T08:00:00+08:00 | ALINTA_PNJ_U2 | 5.696667 |
| 2024-04-29T08:00:00+08:00 | ALINTA_WGP_GT | 11.77611 |
| 2024-04-29T08:00:00+08:00 | ALINTA_WGP_U2 | 0.03611111 |
| 2024-04-29T08:00:00+08:00 | ALINTA_WWF | 5.556112 |
| 2024-04-29T08:05:00+08:00 | ALINTA_PNJ_U1 | 0 |
| 2024-04-29T08:05:00+08:00 | ALINTA_PNJ_U2 | 5.583333 |
| 2024-04-29T08:05:00+08:00 | ALINTA_WGP_GT | 11.83306 |
| 2024-04-29T08:05:00+08:00 | ALINTA_WGP_U2 | 0.03611111 |
| 2024-04-29T08:05:00+08:00 | ALINTA_WWF | 5.548056 |
| 2024-04-29T08:10:00+08:00 | ALINTA_PNJ_U1 | 0 |
| 2024-04-29T08:10:00+08:00 | ALINTA_PNJ_U2 | 5.566668 |
| 2024-04-29T08:10:00+08:00 | ALINTA_WGP_GT | 12.02106 |
Here, facility_code is a dimensional attribute, and dispatch_value is the value.
If I want to focus on a single facility_code, I might use some SQL like
SELECT
    interval_ts,
    dispatch_value
    FROM vw_facility_scada
    WHERE facility_code = 'ALINTA_PNJ_U2'
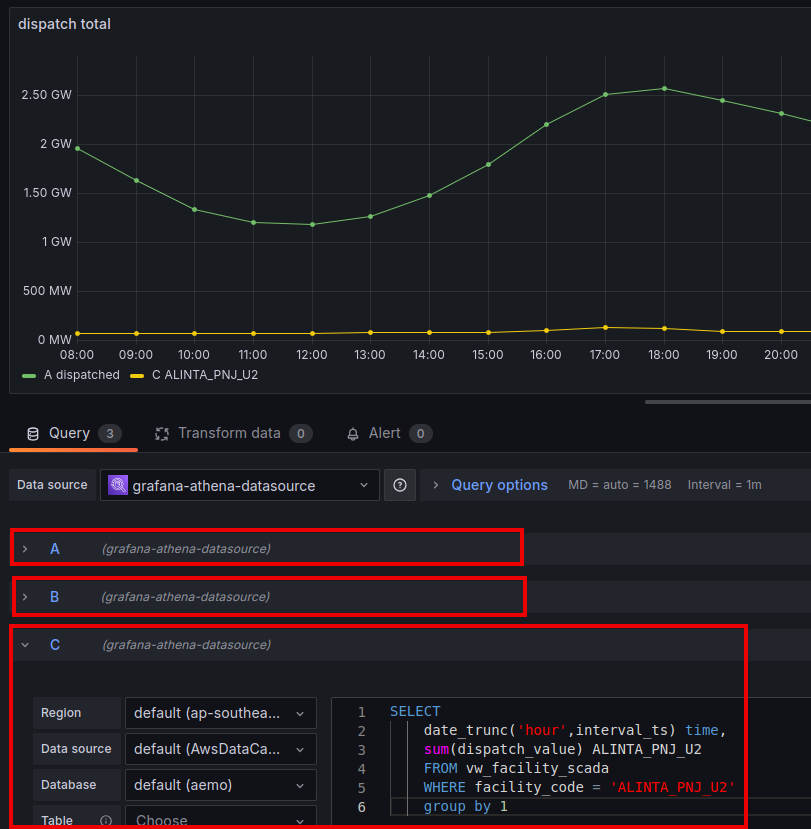
It’s common to add multiple series simply by adding more queries, and Grafana will paint the results on the same graph:
There is a downside, however.
- You have to write a query for every filter / subset you want!
- Each additional series is running another query execution, which is likely to have cost, contention or performance implications
- It requires knowledge ahead of time of what filter values are required (e.g.
facility_code = ALINTA_PNJ_U2), and these must be hardcoded into each query
The Solution
As a user, there’s actually a couple of things I want to be able to do:
- Review the list of dimensional attributes to filter with (in this case, the
facility_code) - Toggle the dimensional attributes we wish to filter by, without modifying the panel or its code
We can achieve this using Grafana Variables, some aggregating SQL code, and a Grafana Panel Transform:
- The Multi-Value Grafana Variable allows us to both view and select our filters
- Our SQL query filters for the selected values, also aggregating all key / value pairs for each time period to a JSON object
- We enable a Grafana Panel Transform to convert each key of the JSON string to a separate column / row value - a dynamic pivot
1. Let’s add a Grafana Variable!
Grafana Variables are very useful for adding dynamic capabilities to dashboards.
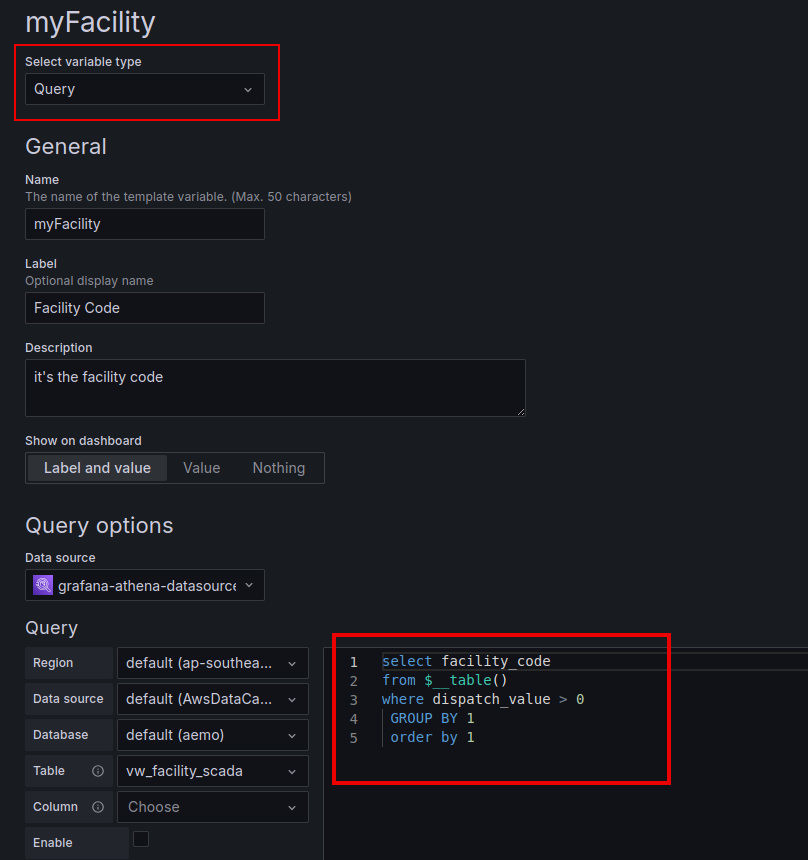
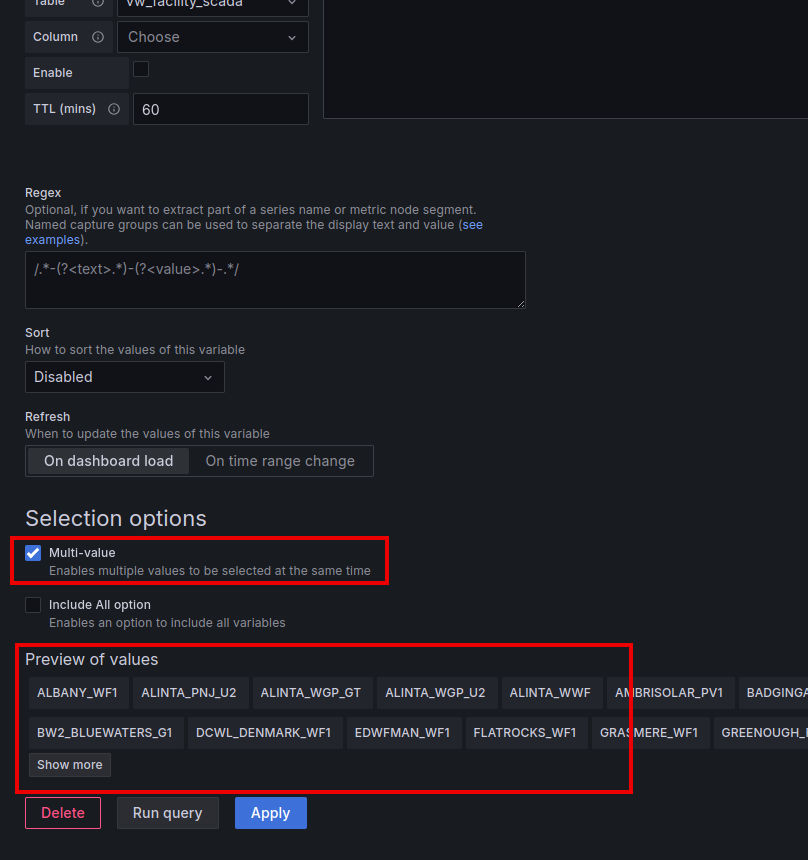
We can create a Grafana Variable to retrieve a distinct list of facility_code, and it will populate a drop down box with the values -
making this multi select is part of the trick that allows us to display multiple series on one graph.
Grafana Variables support a number of different rendering formats. This is important because we must ensure the output of the variable can be rendered in a way that is compatible with the SQL query we are going to write.
We will use the format singlequote, which will turn our Multi Value Grafana Variable into a comma separated list of values, each surrounded by singlequote characters.
E.g. Given the multi-value variable ${myFacility} with selected values
ALINTA_PNJ_U1ALINTA_WGP_GT
Then ${myFacility:singlequote}will produce:
'ALINTA_PNJ_U1','ALINTA_WGP_GT'
2. Filtering SQL query
Let’s start with the basics of filtering our query. This is not the final product, but will show how to use the multi-value Grafana Variable correctly.
WITH filtered AS (
    SELECT
        interval_ts,
        facility_code,
        dispatch_value
    FROM vw_facility_scada
    WHERE facility_code IN ( ${myFacility:singlequote} )
)

SELECT
    interval_ts,
    facility_code,
    dispatch_value
FROM vw_facility_scada
This will create a result as follows - the table rows with strikethough text represent data that will be filtered out (i.e. not returned):
| interval_ts | facility_code | dispatch_value |
|---|---|---|
| 2024-04-29T08:00:00+08:00 | ALINTA_PNJ_U1 | 0 |
| 2024-04-29T08:00:00+08:00 | ALINTA_WGP_GT | 11.77611 |
| 2024-04-29T08:05:00+08:00 | ALINTA_PNJ_U1 | 0 |
| 2024-04-29T08:05:00+08:00 | ALINTA_WGP_GT | 11.83306 |
| 2024-04-29T08:10:00+08:00 | ALINTA_PNJ_U1 | 0 |
| 2024-04-29T08:10:00+08:00 | ALINTA_WGP_GT | 12.02106 |
3. Aggregating the query
At this point, it’s worth pointing out that I am working with Amazon Athena - and examples from this point on are specific to its technology (which is actually based on Trino); regardless, most SQL engines will have equivalent functions you can use to do the aggregation.
The function we are going to work with is MAP_AGG().
Given key and value parameters, it will generate a map based on the GROUP BY columns. Let’s look at an example:
WITH Filtered AS (
    SELECT
        interval_ts,
        facility_code,
        dispatch_value
    FROM vw_facility_scada
    WHERE facility_code IN ( ${myFacility:singlequote} )
)

SELECT
    interval_ts AS "time", -- naming of this column is important for Grafana, later
    CAST(MAP_AGG(facility_code, dispatch_value) AS JSON) AS "map_result"
FROM Filtered
GROUP BY interval_ts
ORDER BY interval_ts
This will result in output as follows:
| time | map_result |
|---|---|
| 2024-04-29 00:00:00 | {“ALINTA_PNJ_U1”:0.0,“ALINTA_WGP_GT”:11.77611} |
| 2024-04-29 00:05:00 | {“ALINTA_PNJ_U1”:0.0,“ALINTA_WGP_GT”:11.83306} |
| 2024-04-29 00:10:00 | {“ALINTA_PNJ_U1”:0.0,“ALINTA_WGP_GT”:11.35667} |
| 2024-04-29 00:15:00 | {“ALINTA_PNJ_U1”:0.0,“ALINTA_WGP_GT”:10.82861} |
| 2024-04-29 00:20:00 | {“ALINTA_PNJ_U1”:0.0,“ALINTA_WGP_GT”:10.10639} |
| 2024-04-29 00:25:00 | {“ALINTA_PNJ_U1”:0.0, “ALINTA_WGP_GT”:9.970834} |
| 2024-04-29 00:30:00 | {“ALINTA_PNJ_U1”:0.0,“ALINTA_WGP_GT”:9.956668} |
An important consideration when using
MAP_AGGis that only a single key and value will be returned in the map for the GROUP combination. When there is more than one row for the GROUP, the value chosen may vary by implementation, so you may wish to introduce your own aggregation beforehand to make the aggregation deterministic, such as by usingMAX,SUM,APPROX_PERCENTILEfunctions, for example.
4. Adding the Panel Transform to unpack the JSON map
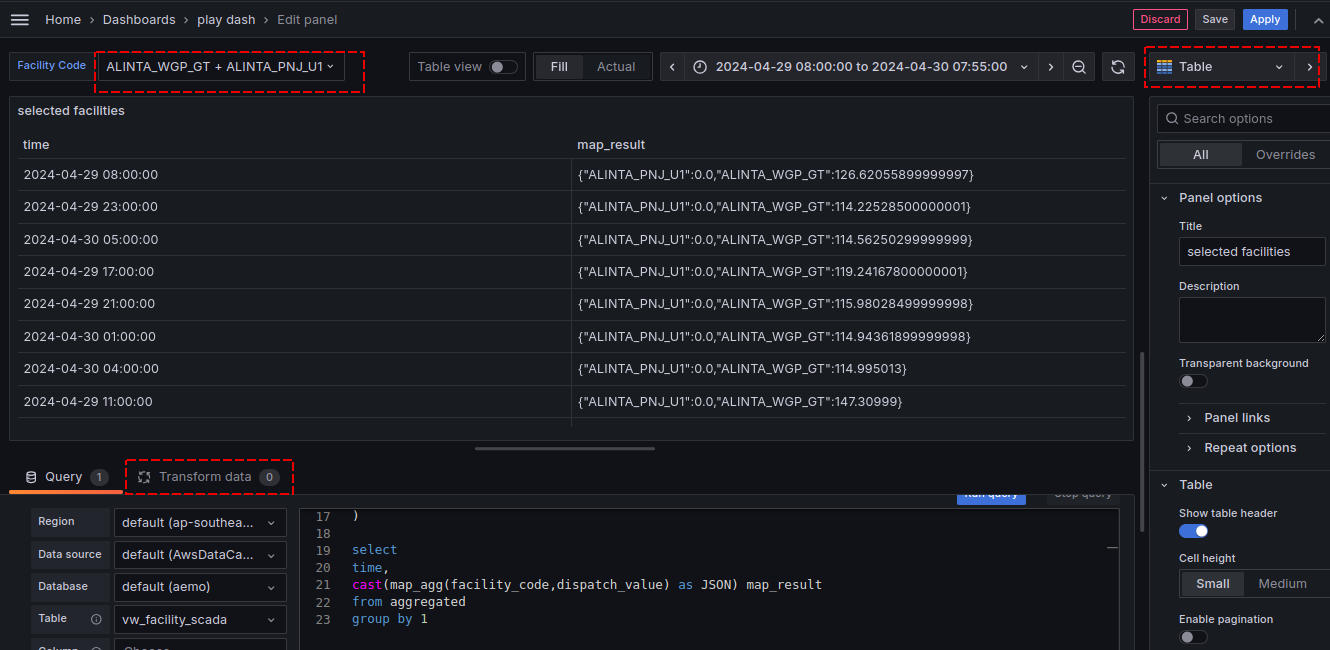
Now let’s take our query and set up a new Grafana Panel to test it out.
When combining queries and transforms, I like to use the Table visualisation, for quick feedback of where I might be running into problems.
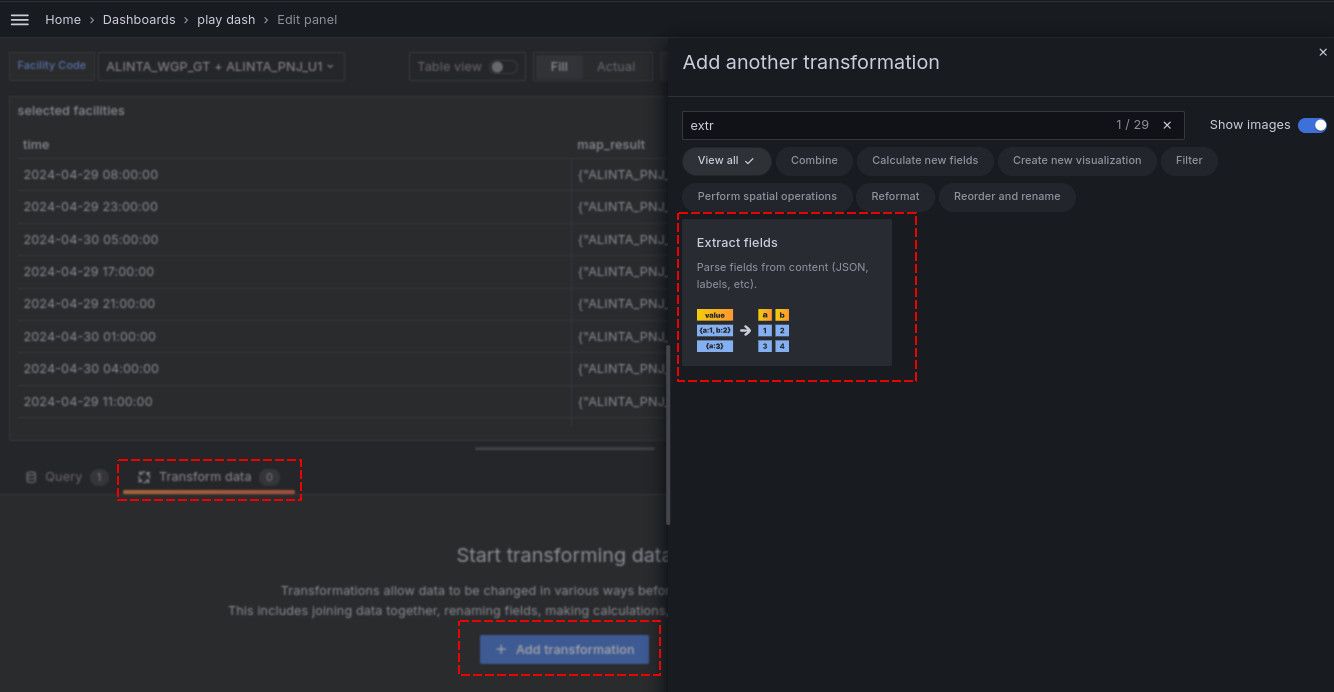
Once you have the basic query working as shown in the images above, you can add the Transform. There are 3 key steps:
- Add the
Extract Fieldstransform as shown above - Select the
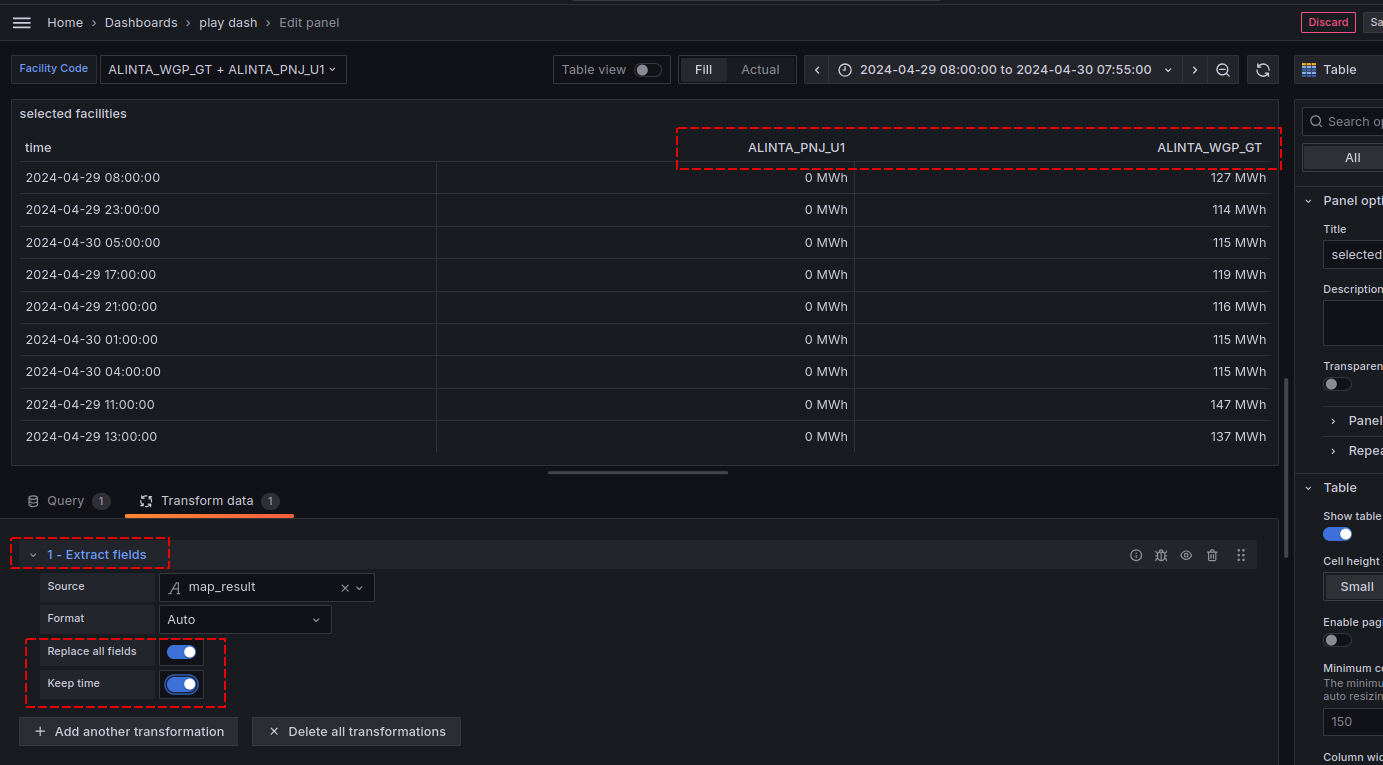
Sourcefield - this is themap_resultcolumn returned in our query above - Enable the
Replace all fieldsandKeep timetoggle boxes. Note - this is why we renamed our column totimepreviously
After these steps are completed, you should notice the original JSON column is gone, and instead each key of the JSON is now a separate column, as shown below:
Now, simply return the panel visualisation to Timeseries and try selecting some different options from your Grafana Variable multi-value selector:
Taking it further with aggregation
Earlier we mentioned that MAP_AGG has implementation specific ways of narrowing duplicate map keys to a single key/value combination.
To avoid this, we can add our own explicit aggregation, prior. Not only does this put us back in control of the aggregation, but can allow us to introduce features like “time bucketing” in a predictable manner, according to the use case we have in mind.
Before jumping into that solution, there’s another function you can use to help you debug - instead of choosing a single value,
it returns an array of all values for the GROUP and key - in Trino, it is called MULTIMAP_AGG. Let’s combine that with a DATE_TRUNC call, to see it in action:
WITH Filtered AS (
    SELECT
        DATE_TRUNC('hour',interval_ts) interval_ts,
        facility_code,
        dispatch_value
    FROM vw_facility_scada
    WHERE facility_code IN ( ${myFacility:singlequote} )
)

SELECT
    interval_ts AS "time", -- naming of this column is important for Grafana, later
    MULTIMAP_AGG(facility_code, dispatch_value) AS "map_result"
FROM Filtered
GROUP BY interval_ts
ORDER BY interval_ts
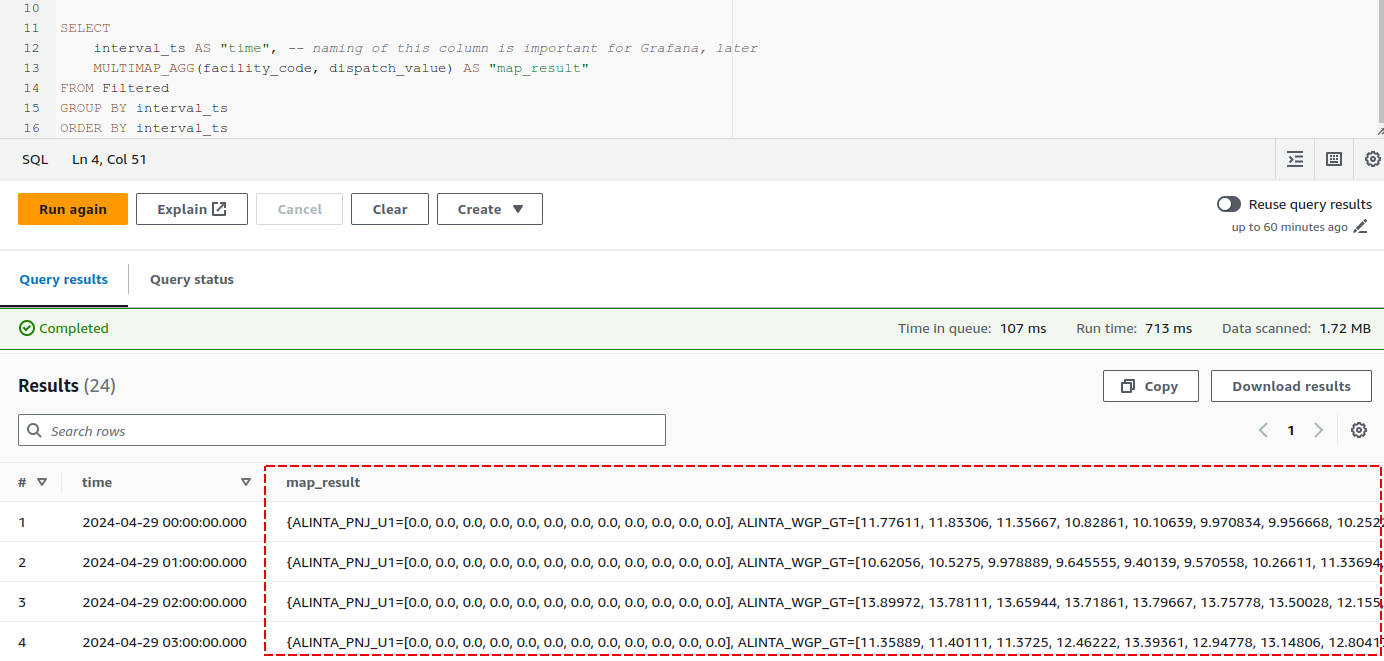
Looking at the results (in Athena, because it didn’t render so well in markdown!),
you can see the grouping by the hourly date truncation produces an array of values for each facility_code key.
Rounding out with a predictable aggregation
At this point, we want to add an aggregation to summarise the value for the map. We could choose from many different functions, such as:
SUM(value)- sum of all values in the groupingMAX(value)- maximum value in the groupingAVG(value)- the average value of the groupingAPPROX_PERCENTILE(value, percentile)- percentile in the group, e.g. a value of0.5would equate to the median value
I like to use APPROX_PERCENTILE for most cases, so here’s an example using that:
WITH FilteredAndAggregated AS (
    SELECT
        DATE_TRUNC('hour',interval_ts) interval_ts,
        facility_code,
        APPROX_PERCENTILE(dispatch_value, 0.5) dispatch_value
    FROM vw_facility_scada
    WHERE facility_code IN ( ${myFacility:singlequote} )
    GROUP BY 1,2 -- group by the date truncation, then the facility_code
)

SELECT
    interval_ts AS "time", -- naming of this column is important for Grafana, later
    CAST(MAP_AGG(facility_code, dispatch_value) AS JSON) AS "map_result"
FROM FilteredAndAggregated
GROUP BY interval_ts
ORDER BY interval_ts
This results look similar, but the values are now based on our chosen aggregation function:
| time | map_result |
|---|---|
| 2024-04-29 00:00:00 | {“ALINTA_PNJ_U1”:0.0,“ALINTA_WGP_GT”:10.25222} |
| 2024-04-29 01:00:00 | {“ALINTA_PNJ_U1”:0.0,“ALINTA_WGP_GT”:10.62056} |
| 2024-04-29 02:00:00 | {“ALINTA_PNJ_U1”:0.0,“ALINTA_WGP_GT”:13.65944} |
| 2024-04-29 03:00:00 | {“ALINTA_PNJ_U1”:0.0,“ALINTA_WGP_GT”:12.28972} |
| 2024-04-29 04:00:00 | {“ALINTA_PNJ_U1”:0.0,“ALINTA_WGP_GT”:12.18695} |
| 2024-04-29 05:00:00 | {“ALINTA_PNJ_U1”:0.0,“ALINTA_WGP_GT”:11.85056} |
| 2024-04-29 06:00:00 | {“ALINTA_PNJ_U1”:0.0,“ALINTA_WGP_GT”:9.606944} |
Conclusion
The diversity of data sources supported by Grafana leads to querying experiences that can vary a lot from one source to the next. Utilising some of Grafana’s lesser known features and add-ons can be a useful way to wring more flexibility out of what you already have!
I hope this has been useful, if you have any feedback, comments or corrections, please reach out!
