The Case for Evidence
by Paul SymonsContents
Summary
Want to skip ahead, and get building with Evidence? Jump to Quick Start
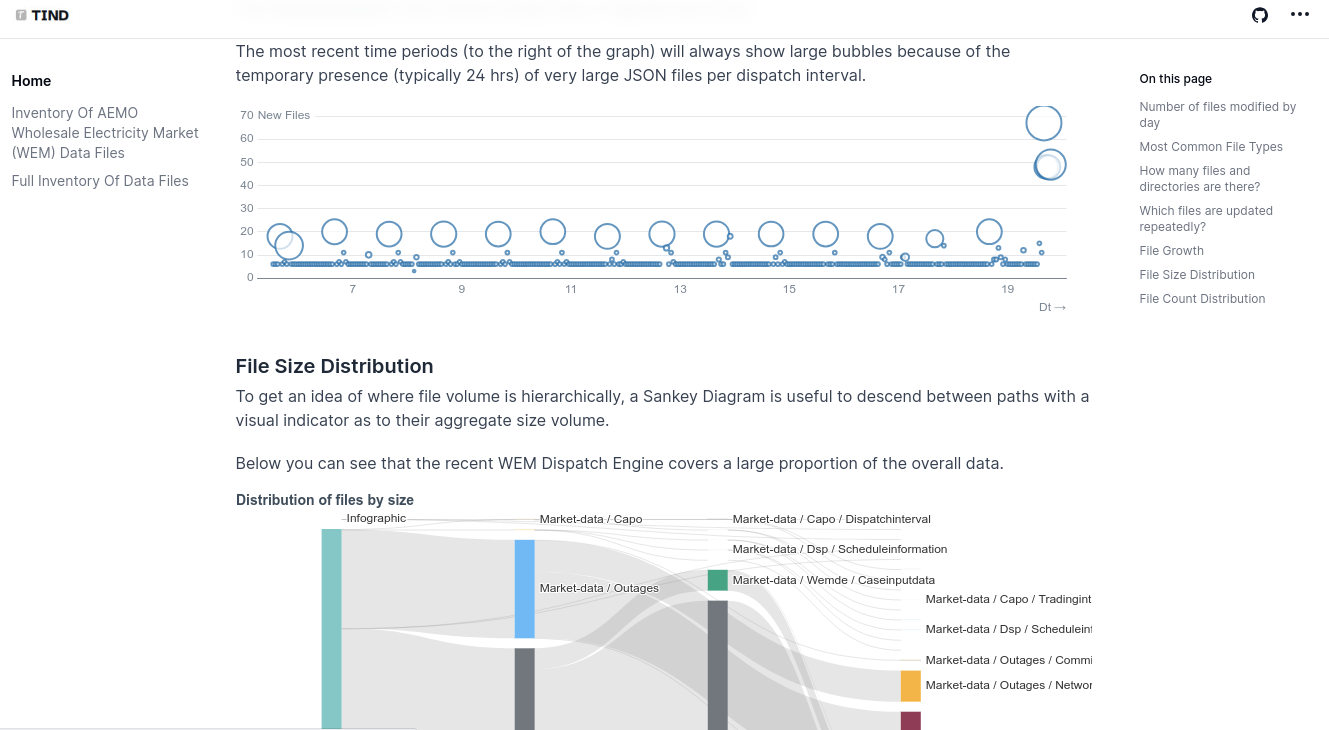
This post focuses on Evidence.dev, a Business-Intelligence as Code project, and how I have used it in the AEMO WEM Data Inventory project I’ve been working on for visualising some public energy market data. It’s a product I’d describe as a “Dashboard Framework Tool” (hereafter referred to as dashtools). Here’s a sample from my first project:
Evidence is a product designed to simplify the visual storytelling of datasets, carving out a space in what is becoming a crowded dashtools market. In recent years, a plethora of these have emerged to serve different niches in this market, most notably the Snowflake acquired Streamlit, but also including:
| Open Source | Commercial |
|---|---|
| - RShiny | - Deepnote |
| - Livebook | - Hex |
| - Voilà | |
| - Panel | |
| - Quarto |
Each dashtool tends to focus on different aspects, all of which are valuable in their own right:
- Simplify content publishing and sharing (e.g. embedding)
- Simplify the authoring process and maximise the productivity of the author
- Reduce code required to make aesthetically appealing content
- Allow the use of dynamic components (e.g. picklists, buttons, sliders) to adapt the content output
You can find the MIT licensed Evidence on Github, or you can rely on their commercial offering (with free tier) Evidence Cloud - which will take the effort out of hosting and productionising your work.
Why is Evidence Different?
There are a few design choices that differentiate Evidence from its peers. That’s not to infer it is better or worse - simply that it gravitates towards particular use cases more than others.
Live vs Computed Data
Most dashtools have some way of working with live data - i.e., when your charts render or your notebook runs, it is querying against your upstream data source, whether that’s a CSV file, a Snowflake Data Warehouse or something else. In many cases, dashtools offer a cache or other means to temporarily store results, to reduce the impact on the data source and improve the experience of the developer or viewer - but for the most part, the data is queried live from the source.
Evidence is different in that when you build for production, it acts as a static site generator. That means everything - including data. Your first impressions might be to see that as a limitation - in so much as, until you re-publish your site, your data will not update.
But the upsides are many; you can:
- Re-build and publish your site as often as you like, to update data
- Deploy with off-the-shelf static hosting options, without “server” based infrastructure
- Enjoy client side delivery model - no worries about scaling infrastructure to meet demand
- Benefit from an air-gapped solution - no risk of data leakage beyond the data you make available using Evidence
In particular, I’ve had a very easy experience using AWS CloudFront as the the “front door” to my static Evidence site; if you don’t want to try out the free plan of Evidence Cloud, it’s worth trying out Netlify for a no-frills low-cost option, though note the caveats on case sensitivity if you do try Netlify.
Low Code
Creating content with Evidence typically requires the following skills
- SQL for populating or manipulating datasets
- Markdown, for authoring page content
- Simple markup for visualisation components.
Many dashtools require the use of a programming language, typically Python - if not for data manipulation, then at least for producing visualisations. Most simplify the process of combining data, visual components and interactive widgets.
In using markdown for narrative and markup for components, Evidence has narrowed on a sweet spot that is conducive to good flow when authoring, and in my opinion, lowered the barrier to entry for producing accessible and high quality data-informed presentations. The video below gives a taster for that developer experience:
A video from https://evidence.dev, demonstrating the developer experience
Evidence comes with a standardised template and page organisation system; it also abstracts the components and simplifies the interface to visualisation components, many of which utilise Apache ECharts.
This allows you to focus on formulating your narrative and … evidence. In this regard, working with Evidence is very much like working with Notebooks.
Code Review and Testability
An understated benefit of Evidence is that the content you create instantly becomes more auditable through conventional
source code repositories such as Github. If you’ve ever attempted to “review” a Jupyter ipynb file, or a
Grafana dashboard json file, you’ll know that it is a painful, if not pointless exercise.
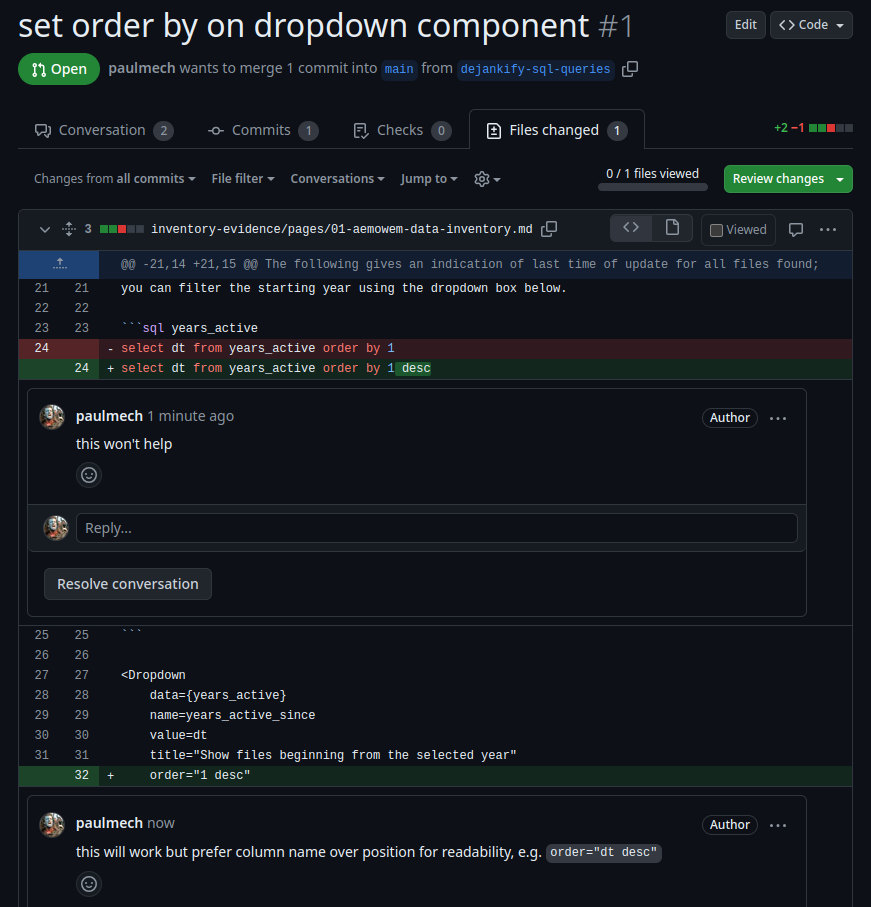
Compare this with the experience in Evidence - constructive critique and feedback is much easer:
This also opens up new avenues of automated testing; given a sample test dataset, continuous integration can perform the likes of screenshot testing using Playwright. While this kind of testing is high up the Testing Pyramid, it’s good to at least have the option.
Content Management
Using Evidence out of the box is very simple; the experience of your users can be maximised, however, if you leverage some of its advanced content management functionality. With these, you can provide a sophisticated interactive data application:
- Pages - independent files used to produce Notebook style presentations
- Sidebar Page Navigation, with customisable behaviour via page frontmatter
- Templates - Routing templates that allow you to use a single template for parameterised content
- Macro Language - features such as Loops and conditionals, combined with your query output, can make for a dynamic presentation model
Read on to find out more.
Build an Experience, not just a Notebook
Notebooks are typically single page - viewed linearly from top to bottom. Evidence excels at creating this kind of content, but can go much further.
Pages
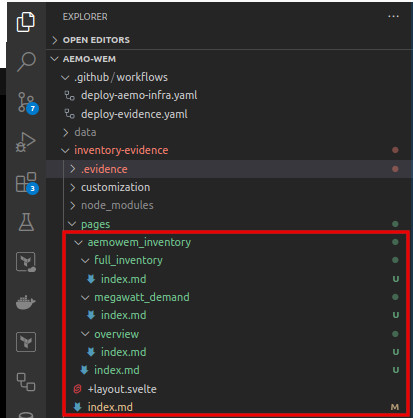
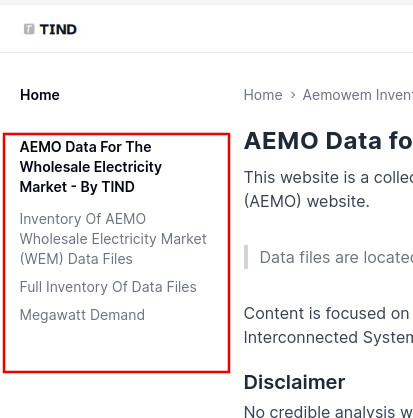
Content in Evidence is organised in pages - each represented by a markdown file. You can optionally create folder structures to organise your content; this is beneficial for you to maintain your pages as a developer, but also structures pages on the sidebar:
You can use page frontmatter to set important attributes such as the page title, opengraph elements, and sidebar positioning ordinals, for example.
If you don’t set a page title in the front matter, the sidebar title will be derived from the structure. For example,
if the title was omitted from the page pages/aemowem_inventory/full_inventory/index.md, then
the page would be titled Full Inventory - it takes the last folder name and replaces characters like underscores and
hyphens with spaces.
Conversely, if the page name is at the root level, it applies the same kind of transformation against the filename itself, instead of the folder name.
I’ve found that the sidebar behaviour is a bit hard to decipher without digging in to the code and a bit of trial and error - the Evidence documentation describes many of the features but not all of the inherent behaviours.
Templates
Page templates are the ultimate feature to explore your data’s dimensions. If you have ever used the Astro web framework, you’ll be familiar with this concept.
Creating a page named inside square brackets - such as [customer_name].md - makes a template page.
When you access that page, a variable called params.customer_name will
be set to the last path component value in the URL. Here are some examples:
| source location | pages/aemowem_inventory/[facility].md |
| sample url | https://w.com/aemowem_inventory/KWINANA_GT3 |
| param.facility | KWINANA_GT3 |
Of course, your param variable is available for you to use in queries you write within the template page. This makes it very simple to construct re-usable pages for dimensional values that by nature are voluminous or not knowable in advance.
Templates In Practice
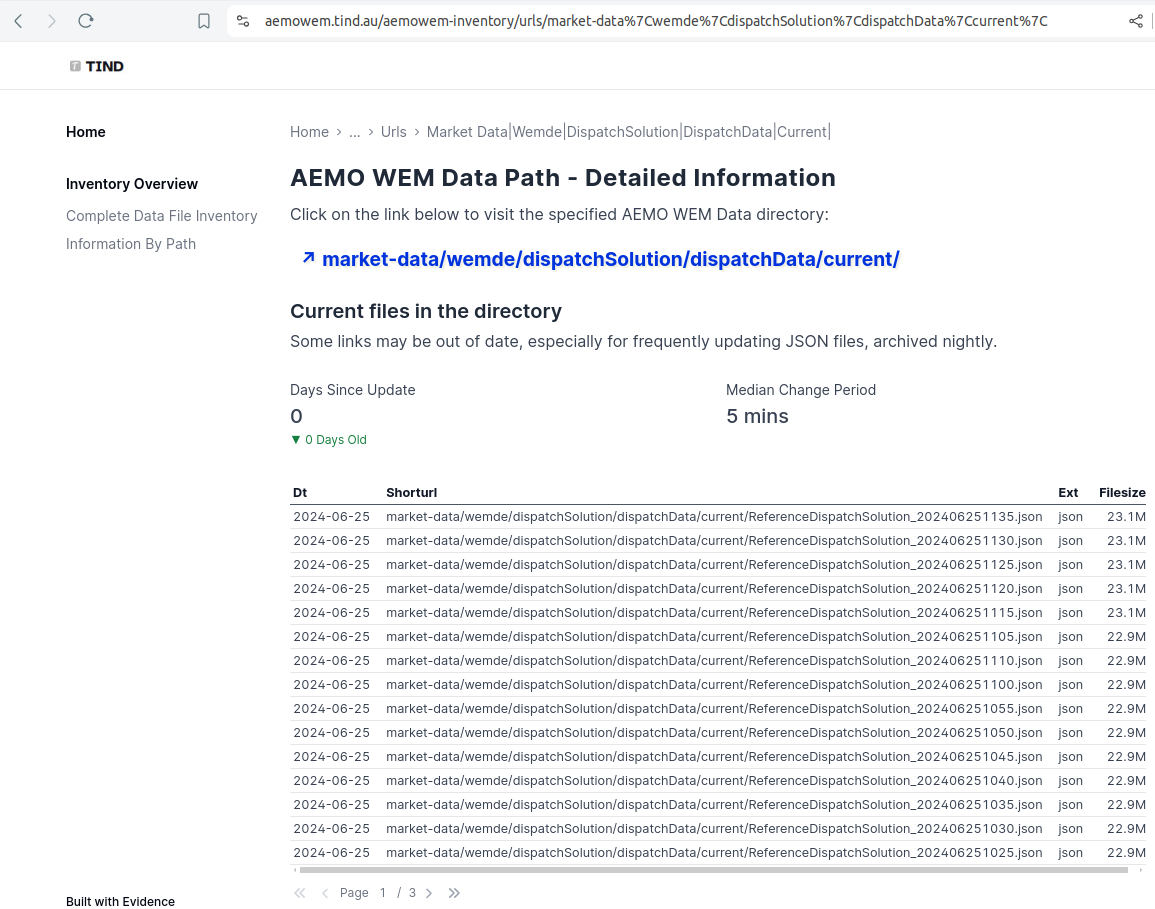
On my AEMO WEM Evidence site, I have a page that lists the 100 or so directories that contain data files on the AEMO WEM Public Data website.
I wanted to use Evidence to show some basic information about each directory. As new directories may be added at any time, and the quantity of directories is already large, I don’t want to create pages manually for each directory.
This is a perfect use case for Templates.
First, I create a page that will list all of the directories. There are a couple of ways you can do this - you could simply loop over the items to create hyperlinks, or as I’ve done in the linked example, use a DataTable - which comes with pagination and hyperlink support built in.
It’s important to reference the data items to be templated, because if you don’t Evidence, will not pre-render them - omitting them from your built site
Next, create your template to represent your repeatable content.
In my example above, my parameter value is actually a URL path component, so I’ve had to do a bit of encoding/decoding to co-operate with the allowable URL semantics:
Quick Start
I hope by now you are keen to give Evidence a try! It’s straight forward to begin:
- Follow the install instructions and note the requirements for Node v18 or v20
- Get familiar with the basic syntax and markdown + markup refresher
- Work out which data sources you want to work with, or just play with the built-in one
- Start Writing, Querying and Charting!
- Deploy your masterpiece for everyone to see!
Conclusion
Without a doubt, Evidence.dev is great fun to work with, and simple to use - you should give it a try!
It does have a couple of rough edges now and again, and the pace of development and change in the project is rapid - so ensure to pin a version when deploying to production.
I highly recommend joining the Slack Community where you will likely find the answers to any questions you have, as well as many friendly people who will help work through your issues.
